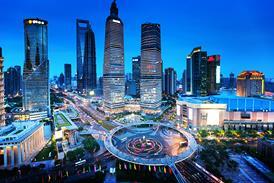
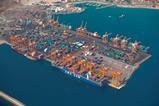
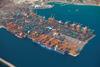
Throughput 2013: 33,639,500 teu – up 3.41 per cent on 2012 (32,529,000 teu)
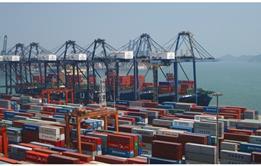
The Chinese behemoth gateway of Shanghai maintained its position as the world’s busiest container port in 2013 after seeing a 3.4 per cent growth in volumes. Although this was a modest increase compared to the double-digit rates seen prior to the recession, it was in line with the management’s targets as the Chinese economy undergoes a generational transformation from one that is export-based to one that relies heavily on domestic consumption.
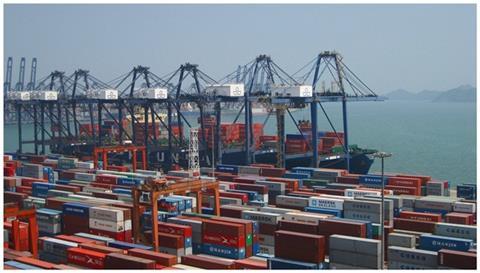
The port’s major operator Shanghai International Port (Group) Co (SIPG) has, since the onset of the recession and the profound changes that this has wrought on global containerised trade flows, understood that it needs to develop a strategy that will still provide it with growth. The SIPG board has warned investors that annual growth in Shanghai will henceforth settle at the 3 per cent mark.
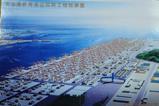
As a result it is moving forward on three fronts: increased investment in Yangtze hinterland facilities, as it seeks to develop an inland network of terminals that feed volumes into its vast offshore Yangshan box hub; attacking the north-east Asian transshipment business that has hitherto been the preserve of non-Chinese ports such as Pusan (Busan) and Kaohsiung, and which grew in Yangshan by 35 per cent last year; and increased investment in international ports, evidenced by its 2010 acquisition of a 25 per cent stake in APM Terminals’ Zeebrugge facility.
The port also introduced two-way navigation last year, leading to shorter waiting times for vessels and better berth utilisation.
Container and Shipping Trade looks at the biggest 10 container ports and compares 2013 throughput with 2012.
Comparative port throughput
| Port | Throughput 2012 (teu) | Throughput 2013 (teu) | Difference (%) |
|---|
| Shanghai |
32529000 |
33639500 |
3.41 |
| Singapore |
31649000 |
32578300 |
2.94 |
| Shenzhen |
22941000 |
23278000 |
1.47 |
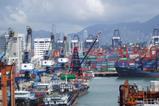
| Hong Kong |
23117000 |
22288000 |
-3.59 |
| Pusan |
17046000 |
17680000 |
3.72 |
| Ningbo |
16175000 |
16770000 |
3.98 |
| Qingdao |
14503000 |
15520000 |
7.01 |
| Guangzhou |
14547000 |
15300000 |
5.18 |
| Dubai |
13280000 |
13641000 |
2.72 |
| Tianjin |
12303000 |
13000000 |
5.67 |